
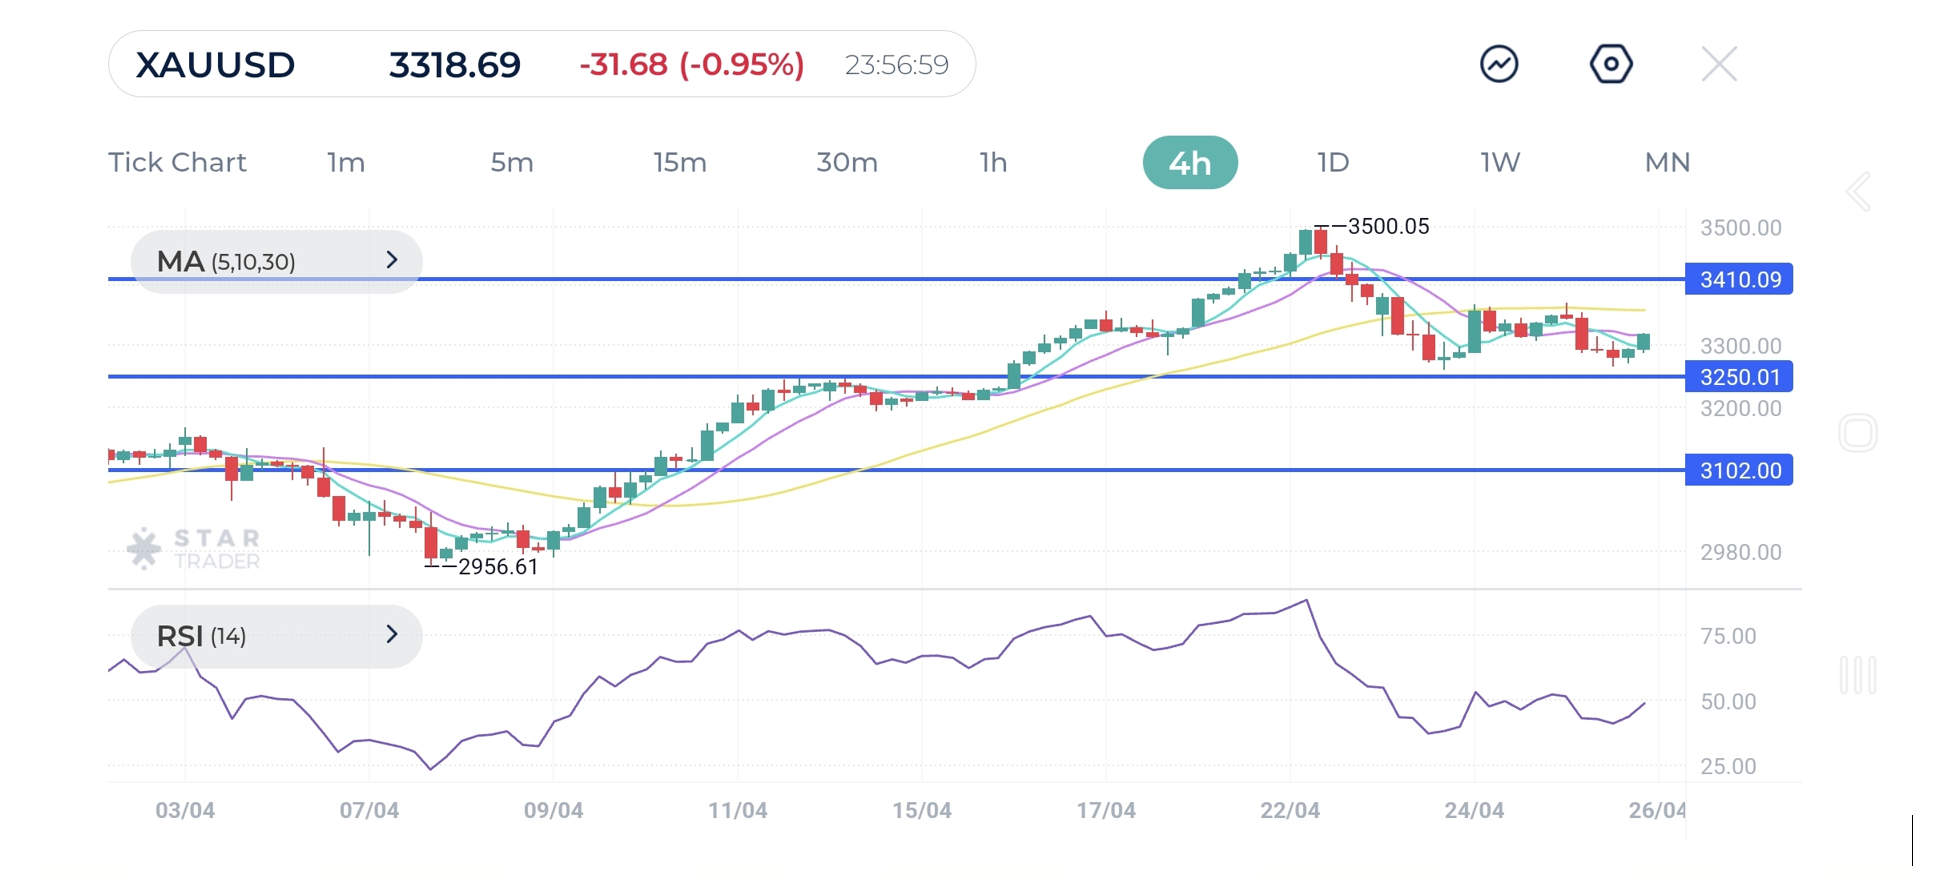
The gold price has been grinding lower in the latest trading sessions, breaking the 30-SMA, increasing negative pressure on the metal in the short-term. Meanwhile, the RSI has given additional negative signals, despite reaching oversold levels. Therefore, the outlook suggests further downside movement, provided the price remains settled below the 3435 level. A continued decline below 3250 could prompt more buyers to leave the table, exposing former resistance from mid-April and the round number of 3100. The expected trading range for the next few days is between the 3250 support and the 3410 resistance levels.
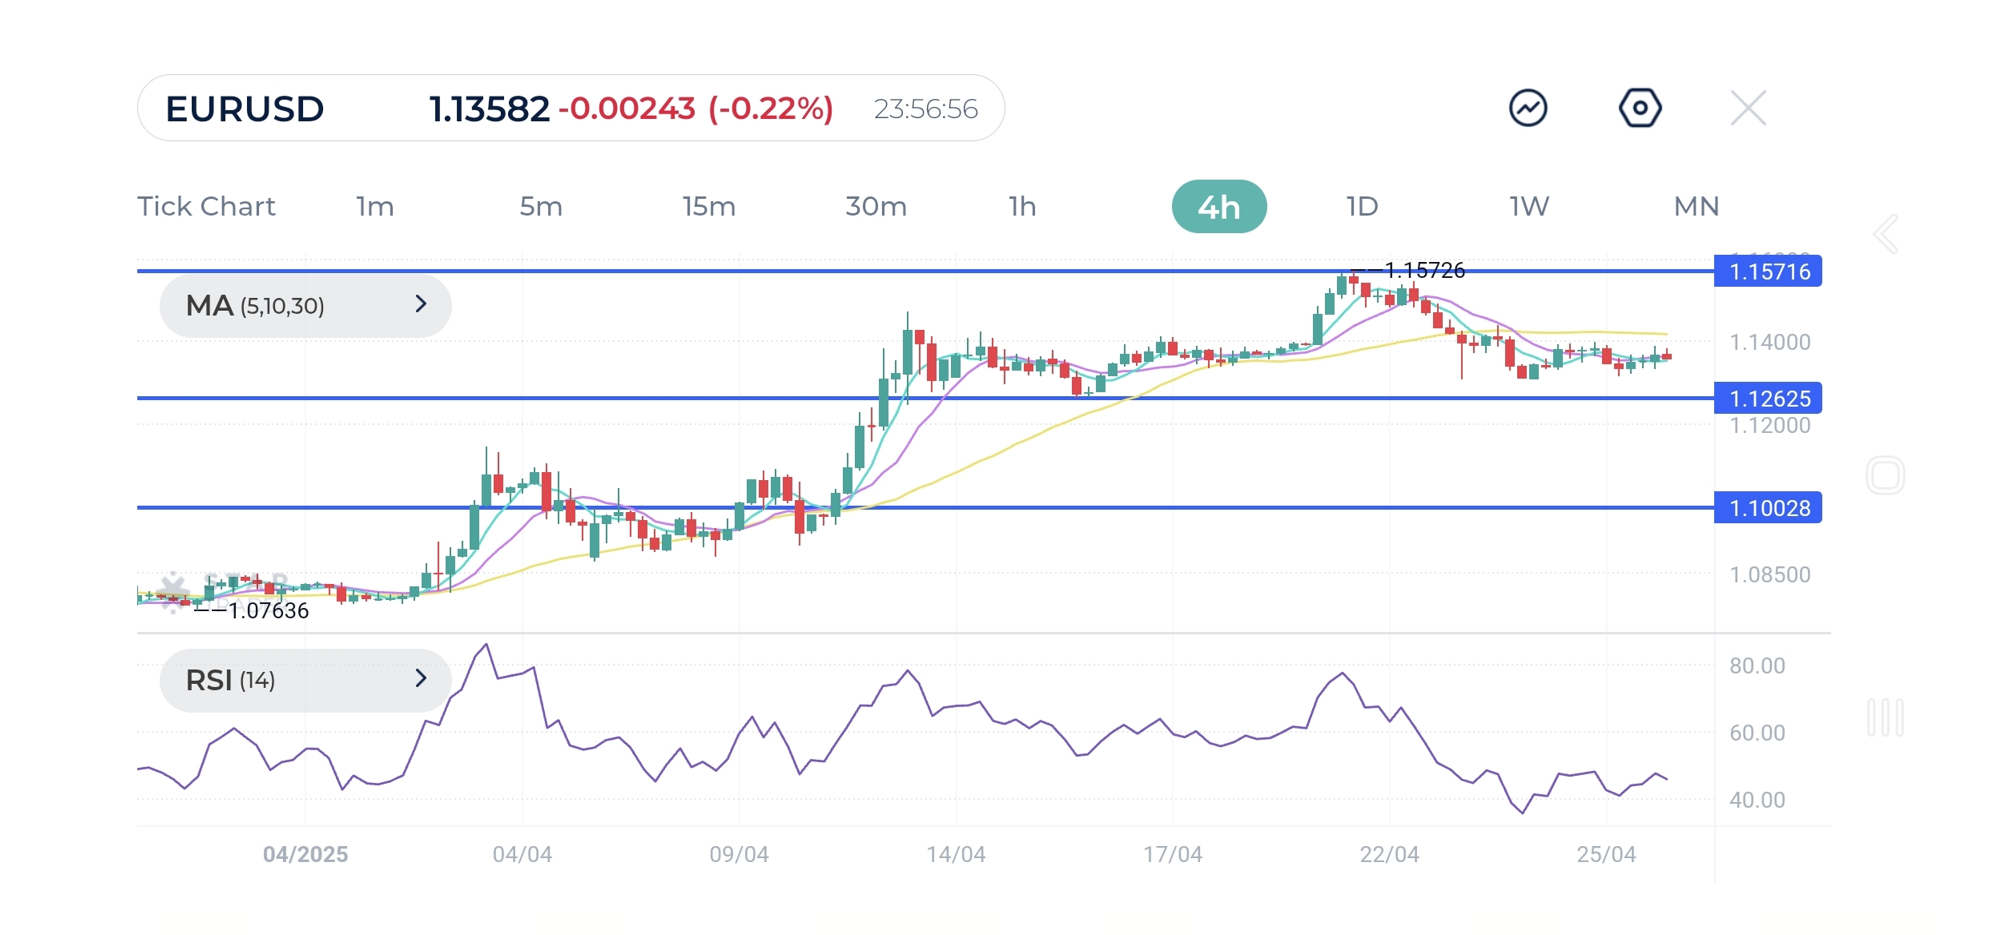
EUR/USD has broken below major support zones around 1.1350, signaling increasing bearish momentum. After encountering strong sellers at the 1.1570 resistance, the pair fell below a key support trendline and dropped under the 30-SMA, confirming a shift to bearish control. Meanwhile, the RSI has slipped below 50, further supporting the bearish outlook. However, for a full confirmation of a reversal, bears must break below the key level of 1.1260 where a decisive move beneath would open the path toward the 1.1000. If that support holds firm, though, bulls could stage a comeback, potentially leading to a retest of the 1.1570 peak.
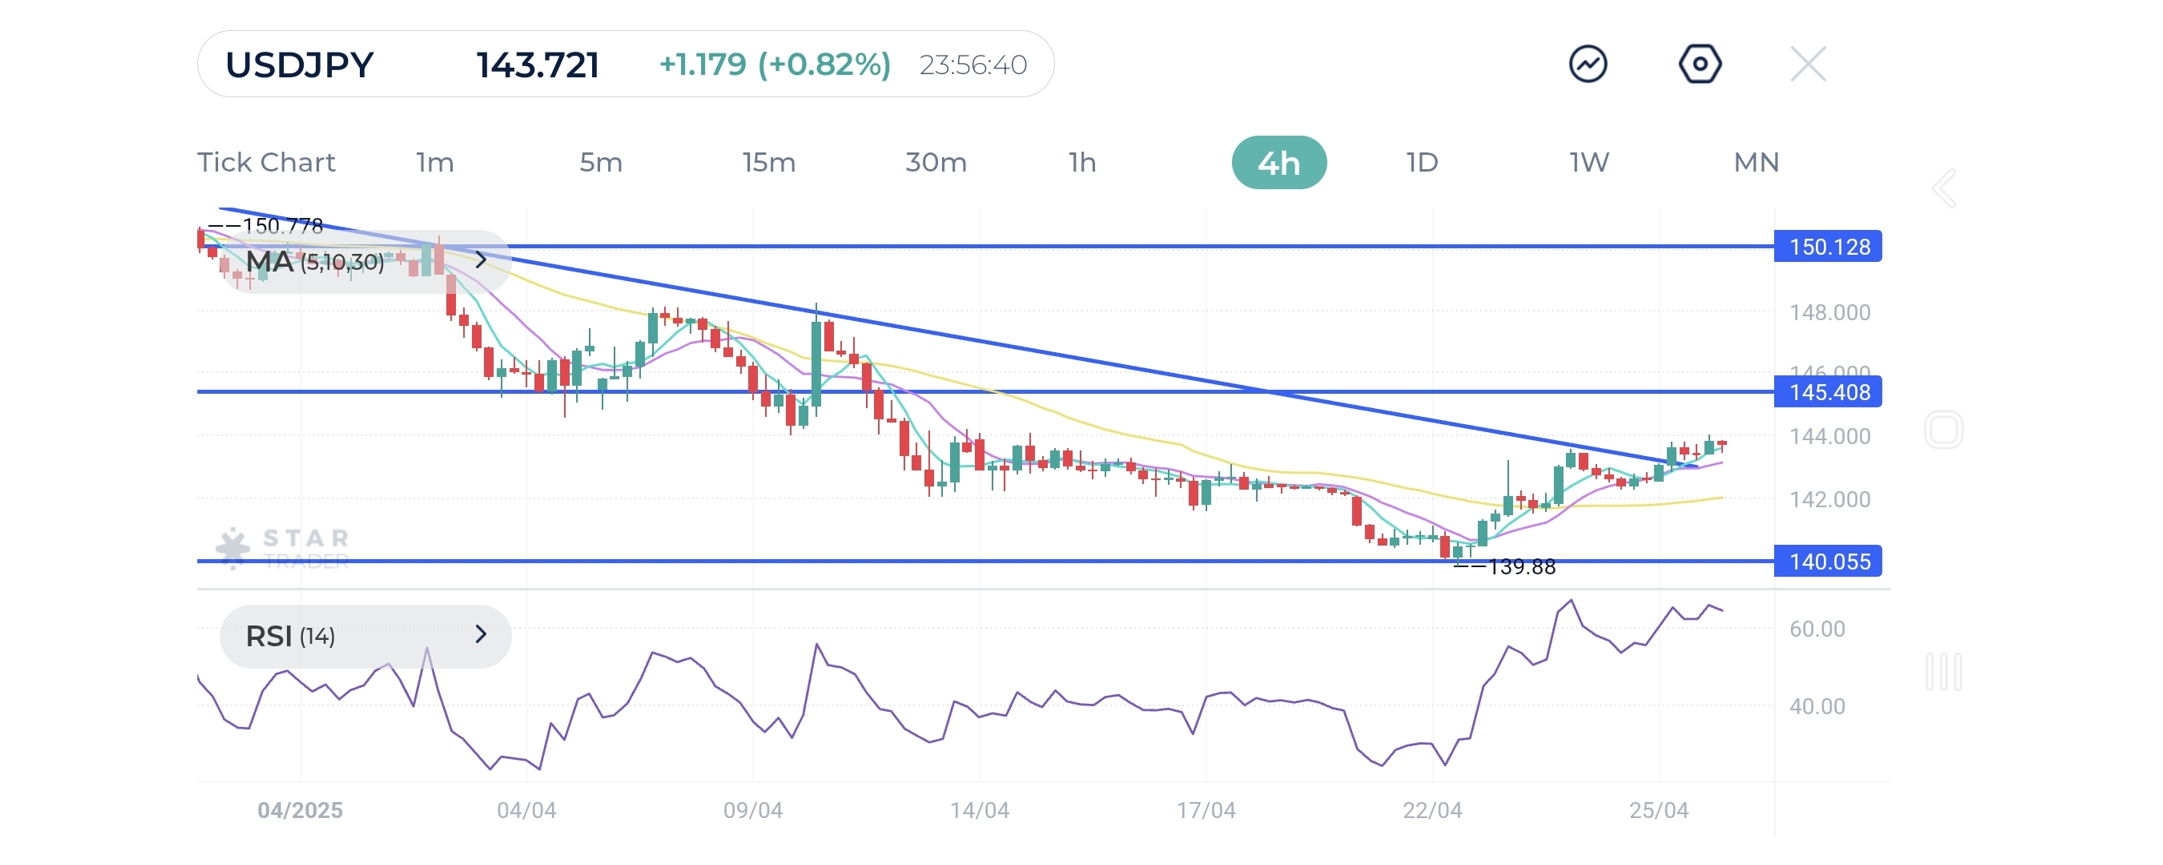
USD/JPY has broken out of its short-term bearish trendline from early April, rising above the 30-SMA, and signaling a bullish shift in sentiment. The price then saw a limited pullback and is trying to climb higher, reinforcing the breakout’s validity. Previously, bears controlled the trend, keeping the price below the SMA. But their momentum stalled at the psychological level of 140.00, allowing bulls to regain control by pushing the price above the SMA. The pair could soon retest the support-turned-resistance of 145.40 where a breach would confirm a new uptrend and strengthen the bullish bias.
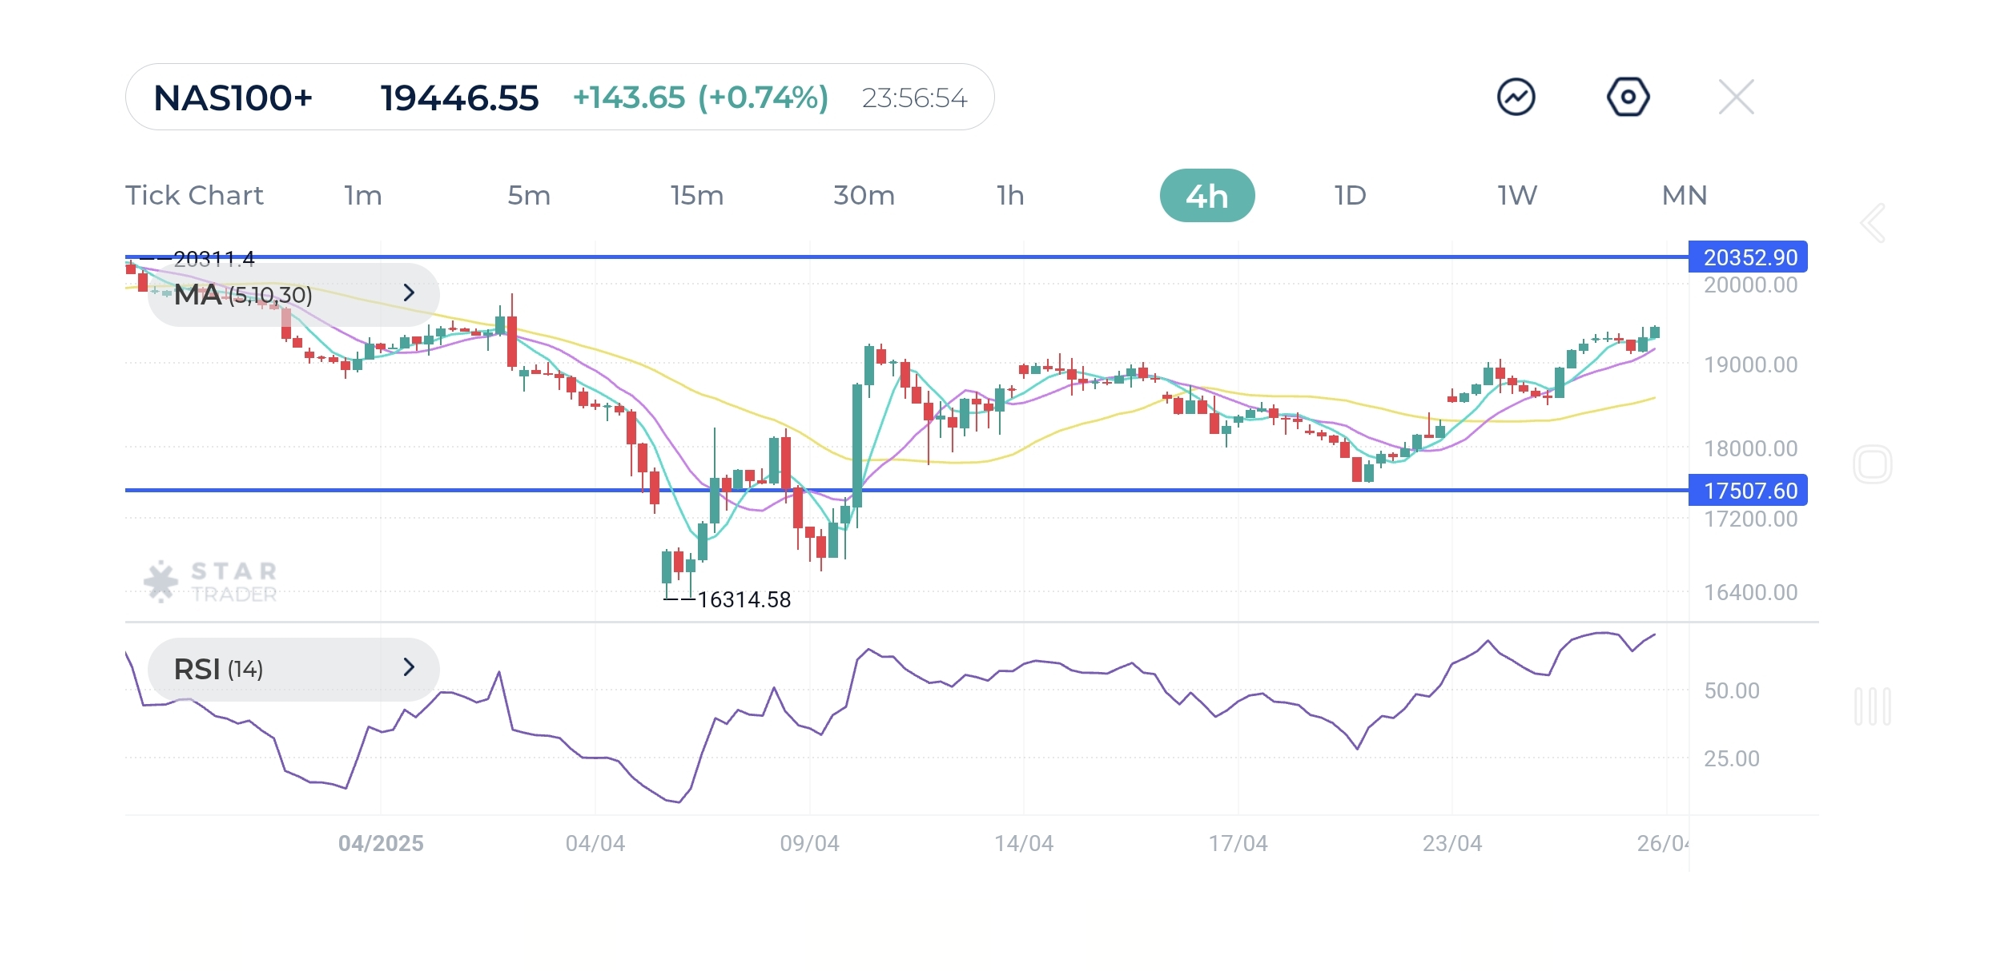
The Nasdaq 100 has broken the floor of the rising trendline from the daily chart perspective, indicating a weaker climbing rate at first or a more horizontal development in the weeks to come. However, the index has successfully cleared the resistance level of 19200, giving a positive signal for the short-term trading range. Immediate support is now seen at 17500, with 16310 as a critical level to keep the rebound intact. On the upside, 20350 stands as major resistance. Overall, the index is assessed as technically slightly positive for the near term.
Tags
Open Live Account
Please enter a valid country
No results found
No results found
Please enter a valid email
Please enter a valid verification code
1. 8-16 characters + numbers (0-9) 2. blend of letters (A-Z, a-z) 3. special characters (e.g, !a#S%^&)
Please enter the correct format
Please tick the checkbox to proceed
Please tick the checkbox to proceed
Important Notice
STARTRADER does not accept any applications from Australian residents.
To comply with regulatory requirements, clicking the button will redirect you to the STARTRADER website operated by STARTRADER PRIME GLOBAL PTY LTD (ABN 65 156 005 668), an authorized Australian Financial Services Licence holder (AFSL no. 421210) regulated by the Australian Securities and Investments Commission.
CONTINUEImportant Notice for Residents of the United Arab Emirates
In alignment with local regulatory requirements, individuals residing in the United Arab Emirates are requested to proceed via our dedicated regional platform at startrader.ae, which is operated by STARTRADER Global Financial Consultation & Financial Analysis L.L.C.. This entity is licensed by the UAE Securities and Commodities Authority (SCA) under License No. 20200000241, and is authorised to introduce financial services and promote financial products in the UAE.
Please click the "Continue" button below to be redirected.
CONTINUEError! Please try again.