Gold is showing a strong uptrend from 3202.05 to 3438.08, followed by a sharp recent drop. Price is currently consolidating after breaking the short-term trendline.
Indicators:
Price broke below moving averages MA (5) and MA(10) with a clear bearish crossover and it’s now testing the moving average (30) indicating potential short-term weakness.
RSI (14) fell sharply from overbought to the neutral areas suggesting loss of bullish momentum.
Key Levels to watch for today’s movement are:
Support: 3360 and 3320
Resistance: 3438
If price breaks below the moving average 30 MA with RSI staying weak, we can expect deeper correction toward 3320. However, a bounce above 3385 with volume could ignite bullish momentum again.
Gold 1H Chart
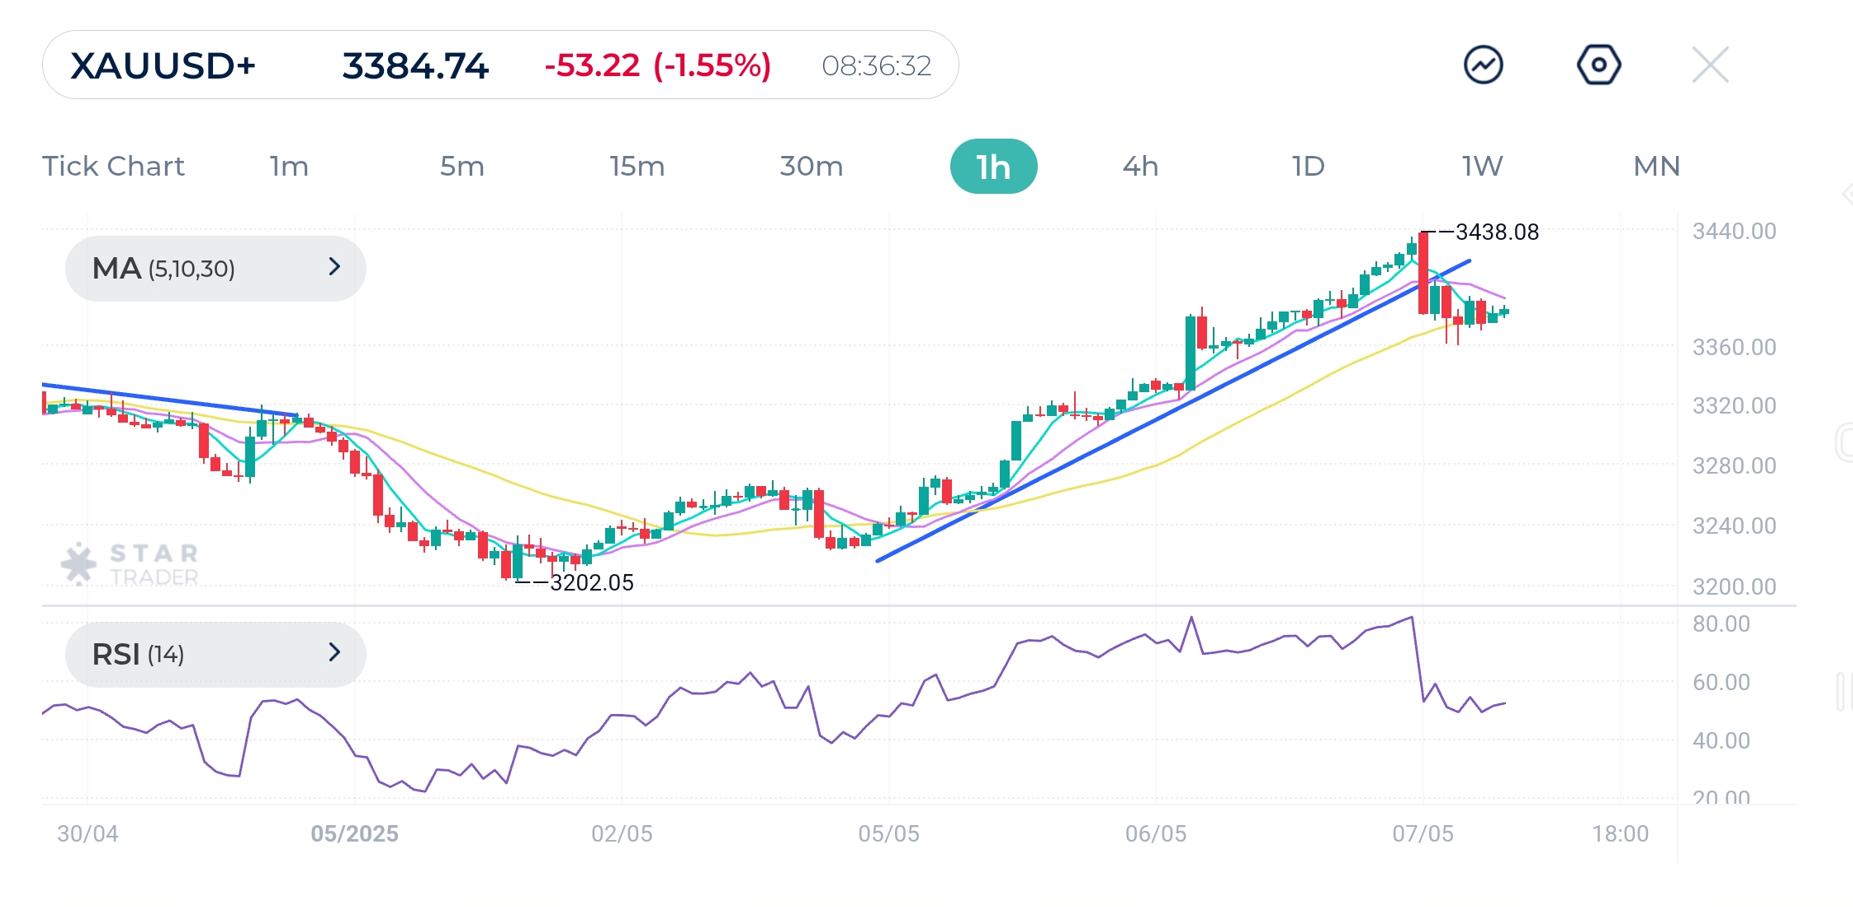
| Resistance | $3,405 | $3,438 | $3,464 |
| Support | $3,360 | $3,351 | $3,330 |
USDJPY shows Downtrend from 145.90 to 142.35, but recently showing signs of a possible reversal with higher lows forming. Moving averages (5,10,30) start to show bullish reversal with upside crossover.
RSI rebounded strongly from oversold to above 50, indicating recovery starting
Key Levels to watch out for today are:
Support: 142.35
Resistance: 143.30 and 144.00
If price breaks and holds above 143.30, a rise is expected towards 143.70 levels.
Failure to break the moving average 30 might put pressure on price to retest 142.35
USDJPY 1H Chart
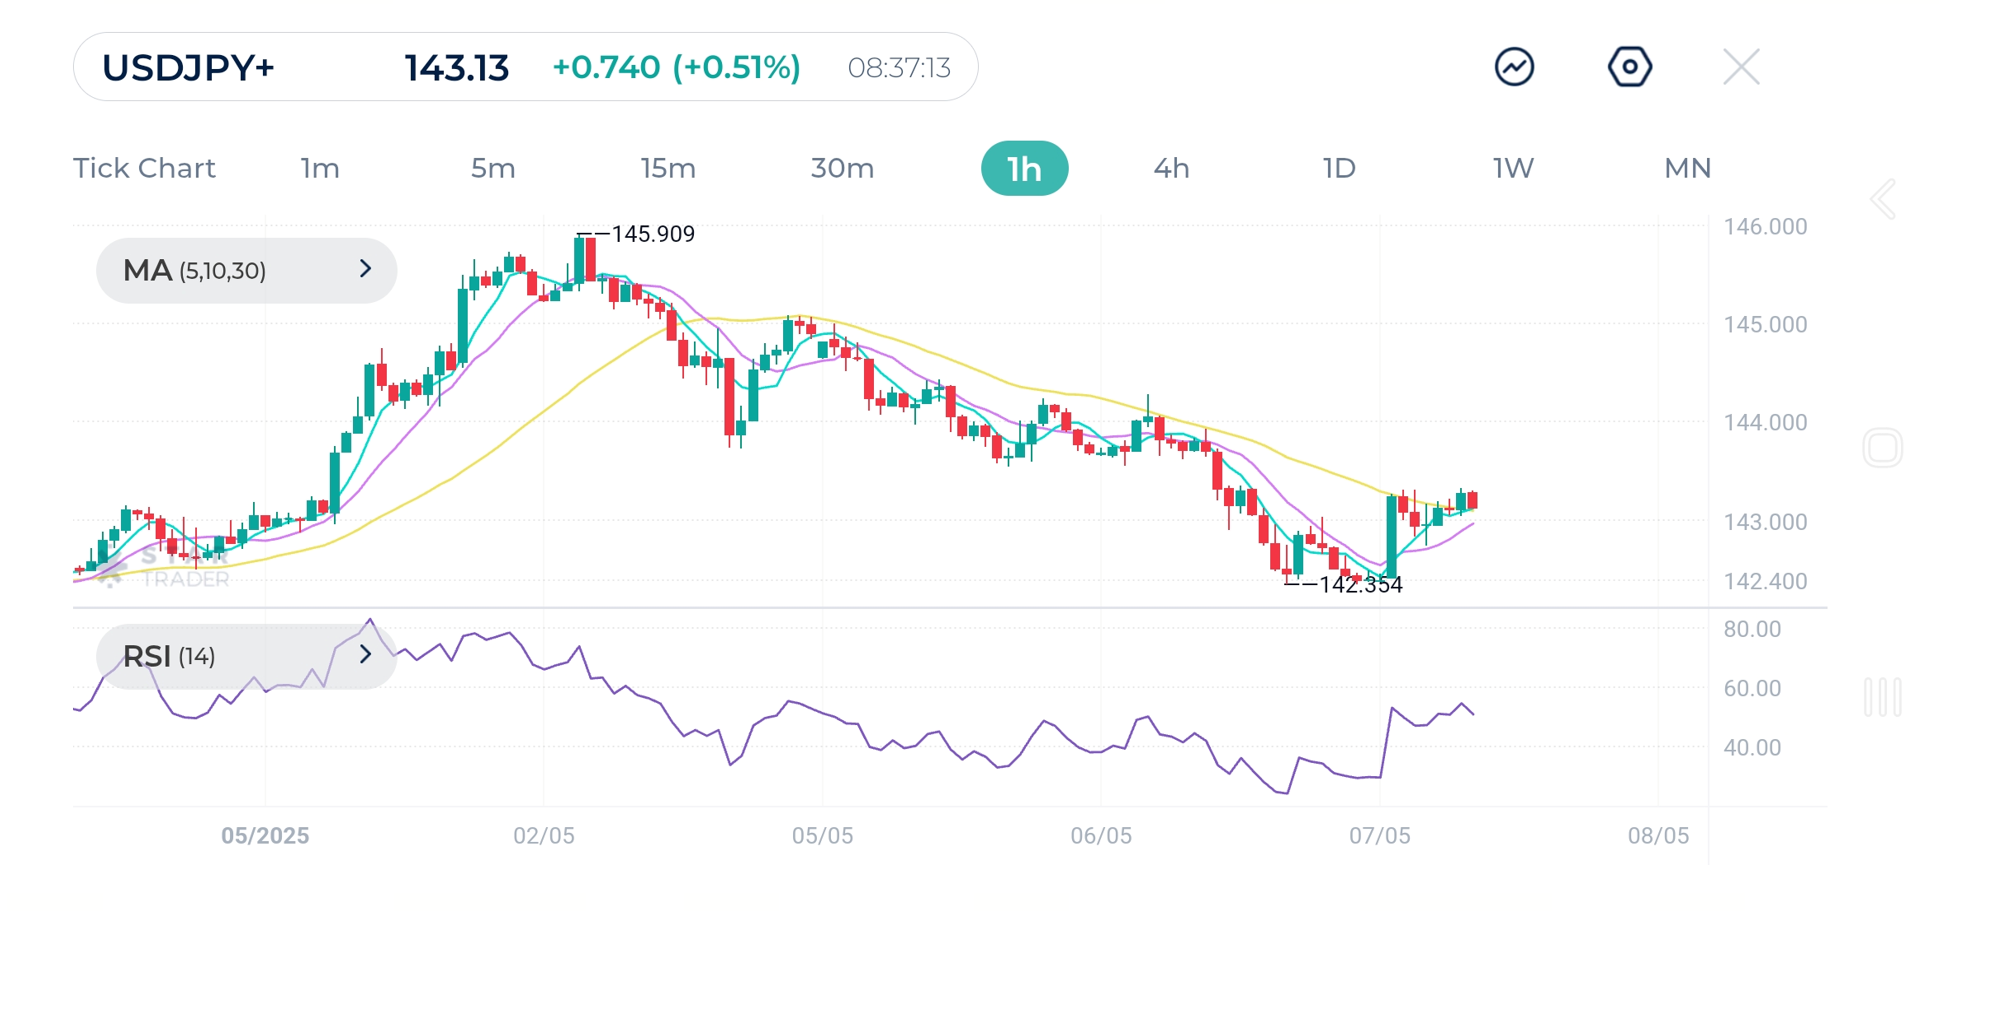
| Resistance | 143.32 | 143.54 | 143.93 |
| Support | 142.75 | 142.35 | 141.98 |
WTI (USOUSD) 1H Chart
Oil shows reversal from a strong downtrend, currently in a short-term uptrend with higher highs and higher lows. Price is above all MAs, confirming bullish momentum. RSI is holding it at around 60–65, signaling healthy bullishness without being overbought.
Key Levels to watch for today’s movement:
Support: 59.00
Resistance: 60.50 – 61.00
As long as price holds above 59.00 and moving averages remain supportive, oil could retest 61.00.
Dropping below 59.00 may ignite a move toward 57.80.
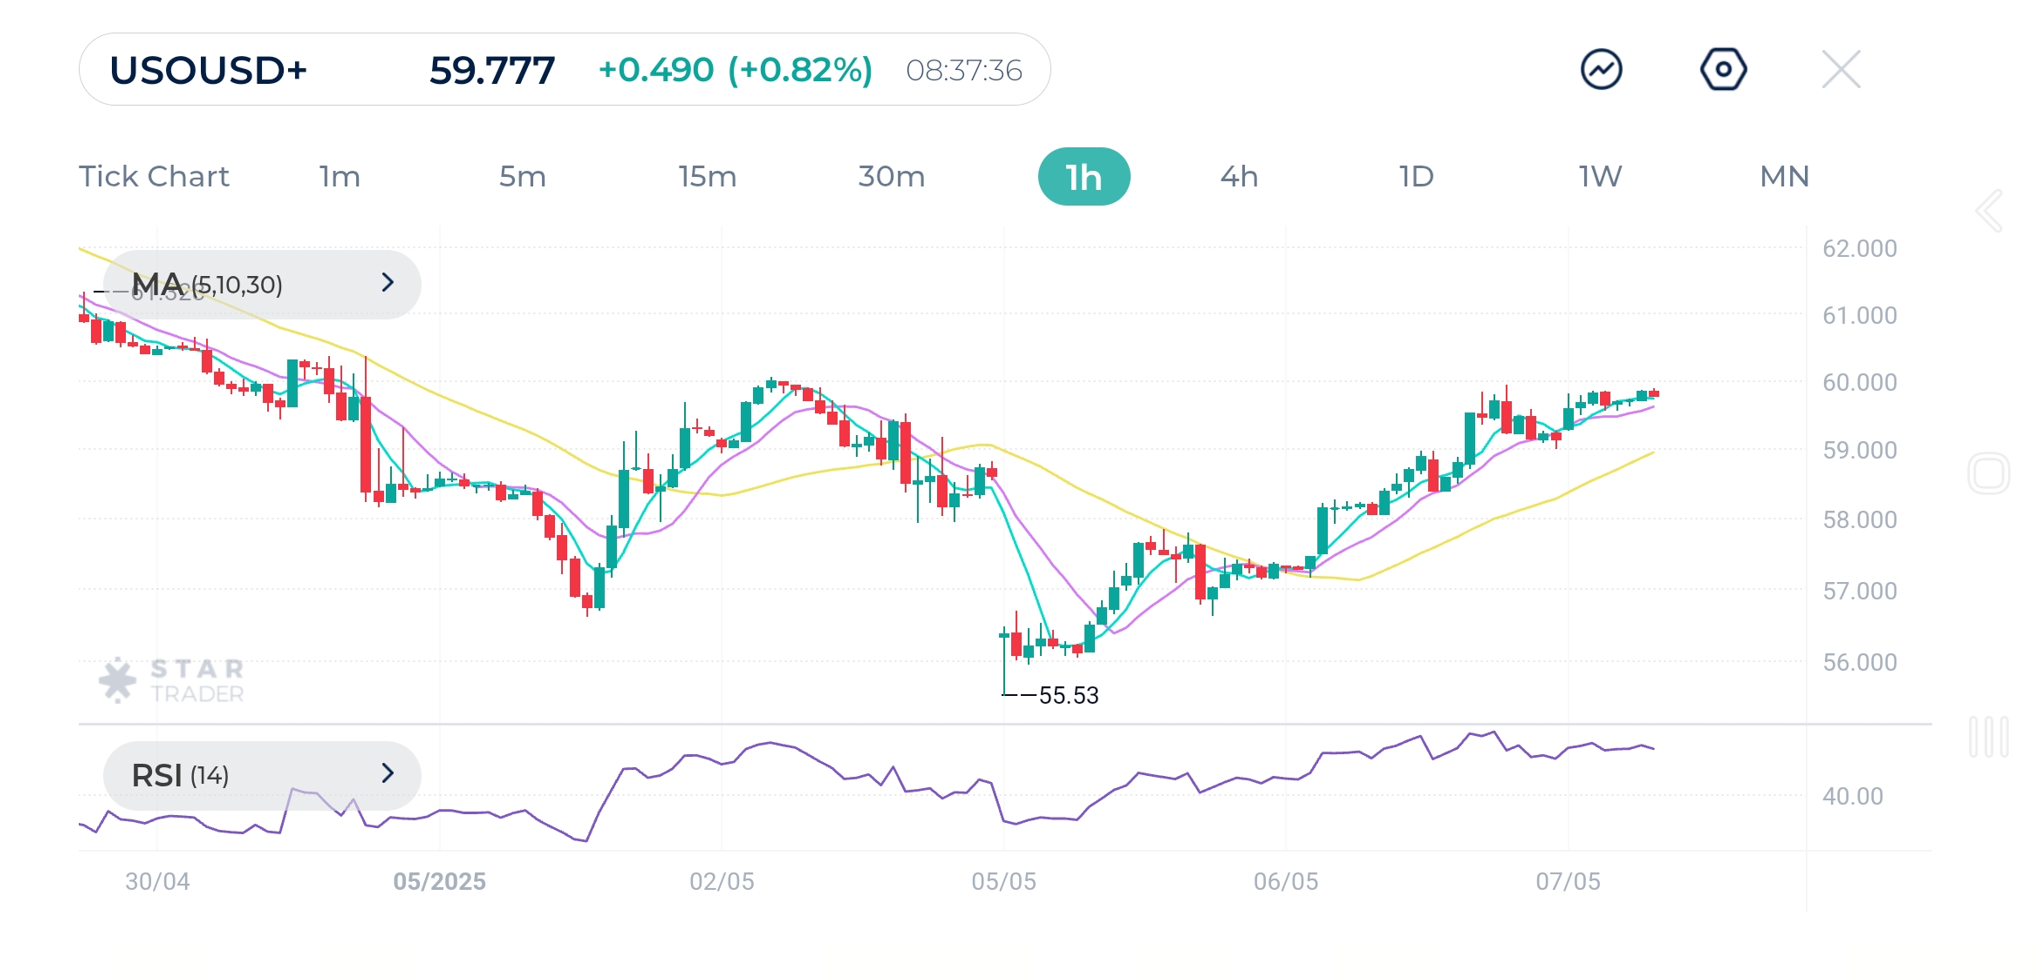
| Resistance | $59.85 | $60.18 | $60.42 |
| Support | $59.08 | $58.50 | $57.97 |
Tags
Open Live Account
Please enter a valid country
No results found
No results found
Please enter a valid email
Please enter a valid verification code
1. 8-16 characters + numbers (0-9) 2. blend of letters (A-Z, a-z) 3. special characters (e.g, !a#S%^&)
Please enter the correct format
Please tick the checkbox to proceed
Please tick the checkbox to proceed
Important Notice
STARTRADER does not accept any applications from Australian residents.
To comply with regulatory requirements, clicking the button will redirect you to the STARTRADER website operated by STARTRADER PRIME GLOBAL PTY LTD (ABN 65 156 005 668), an authorized Australian Financial Services Licence holder (AFSL no. 421210) regulated by the Australian Securities and Investments Commission.
CONTINUEImportant Notice for Residents of the United Arab Emirates
In alignment with local regulatory requirements, individuals residing in the United Arab Emirates are requested to proceed via our dedicated regional platform at startrader.ae, which is operated by STARTRADER Global Financial Consultation & Financial Analysis L.L.C.. This entity is licensed by the UAE Securities and Commodities Authority (SCA) under License No. 20200000241, and is authorised to introduce financial services and promote financial products in the UAE.
Please click the "Continue" button below to be redirected.
CONTINUEError! Please try again.