
Oil prices are dropping slightly in today’s trading session and it’s currently hovering around the dynamic support of moving average MA(30). Short term support level to watch out for is $62.50. Falling below this level and closing on the hourly chart warns of more declines toward the gap at $61.70
MACD shows bearish momentum. If price remains above $63.00 level today, it’s positive for oil this week.
West Texas Intermediate (USOUSD) 1H Chart
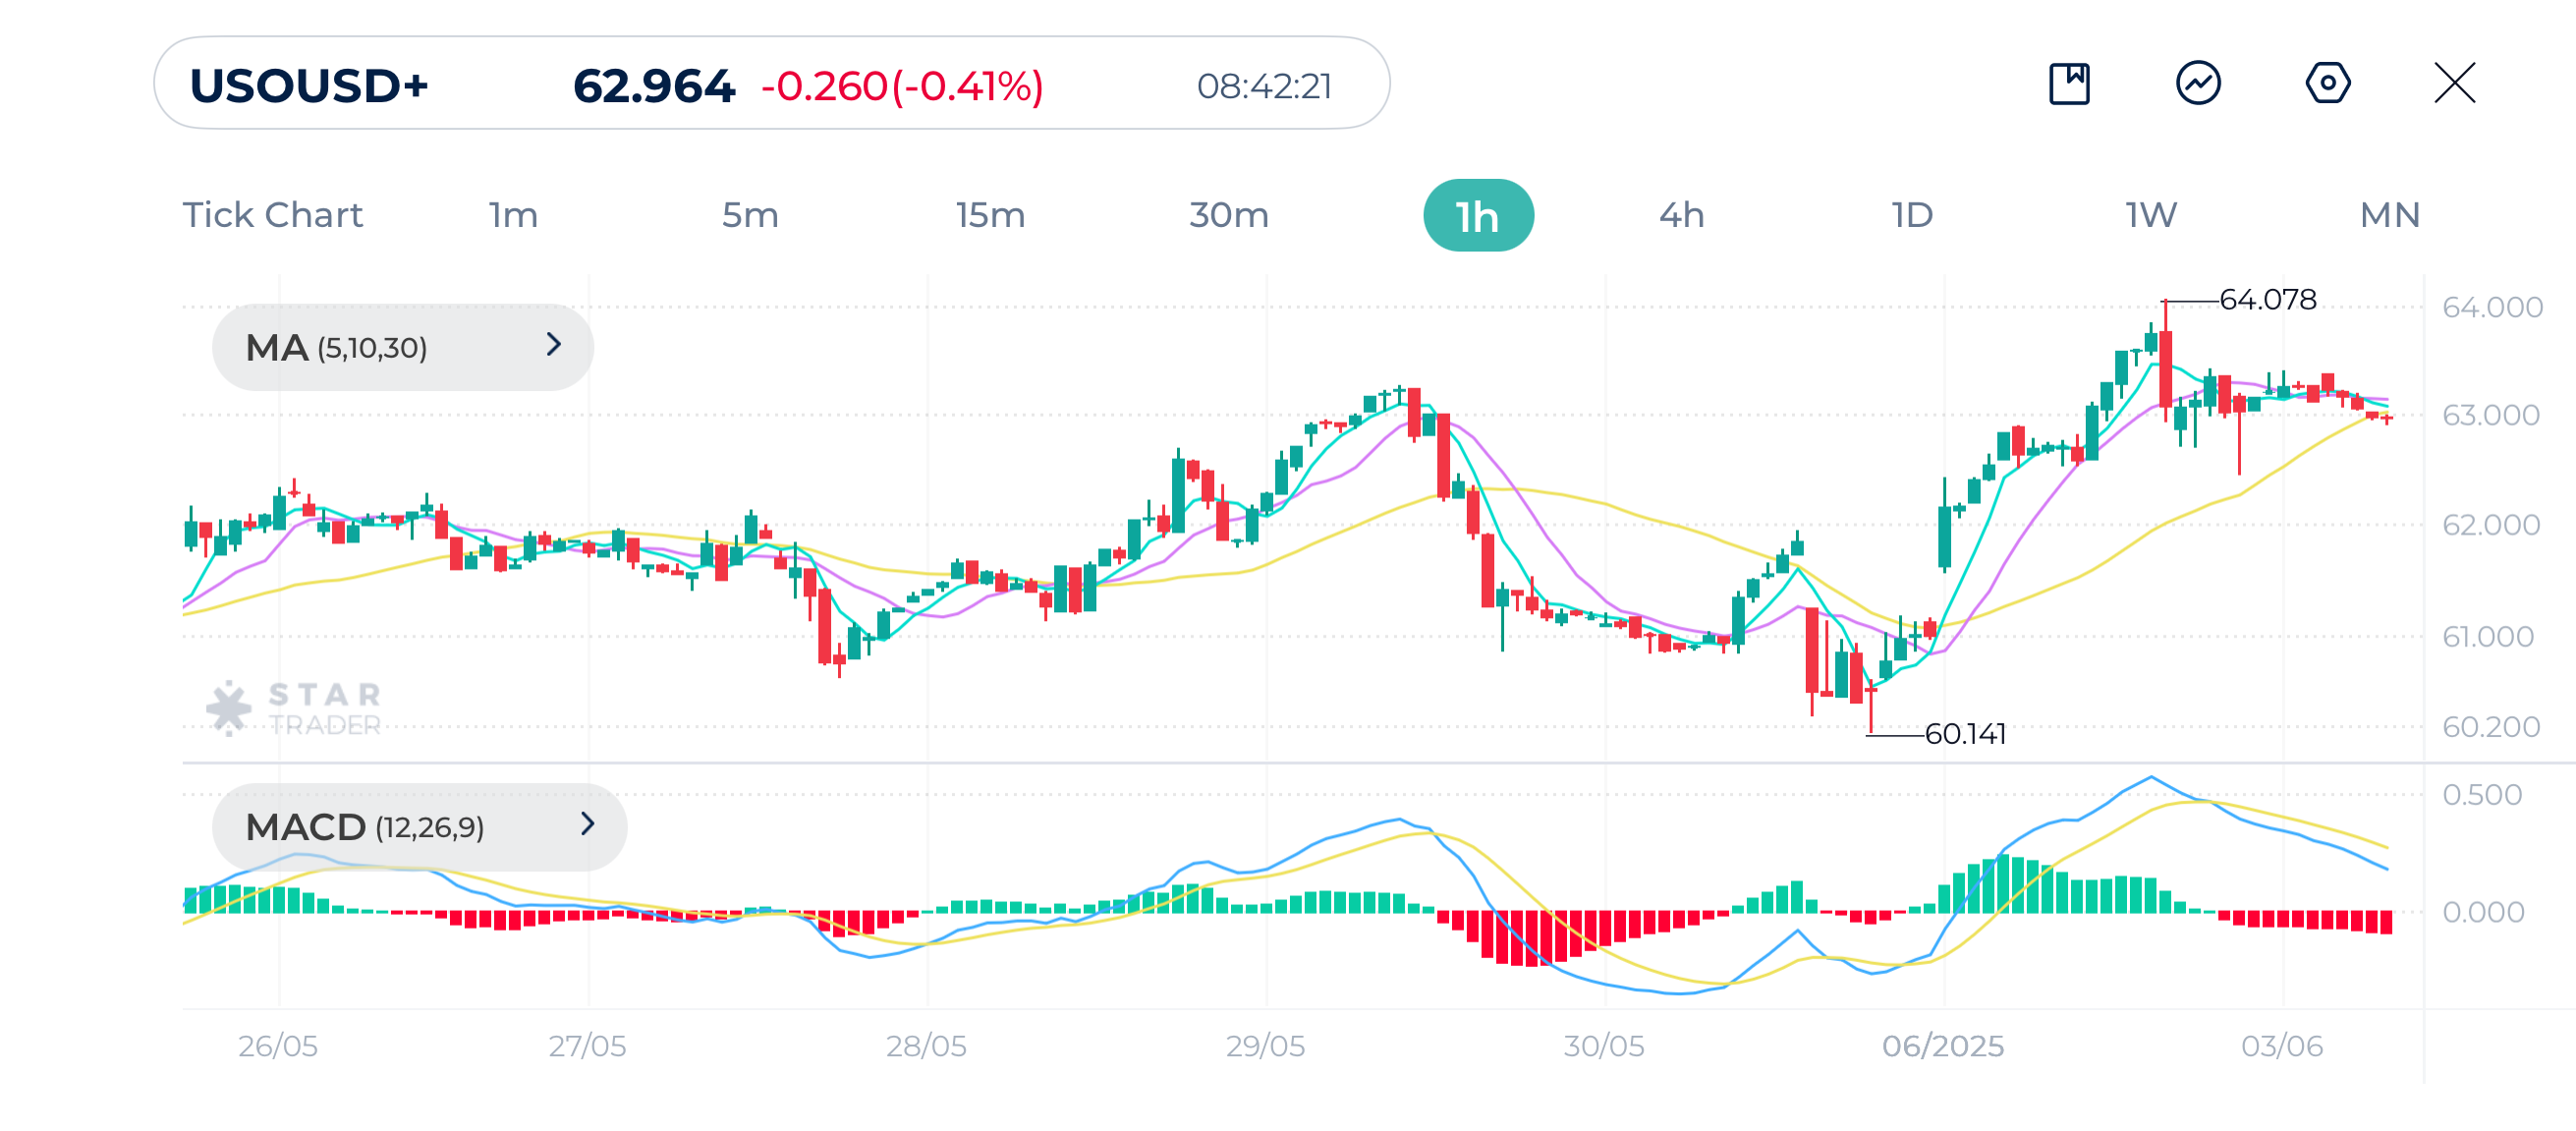
| Resistance | $62.63 | $63.24 | $63.57 |
| Support | $61.70 | $61.30 | $61.13 |
GBPUSD broke out of a short-term downtrend from the previous week and is attempting a bullish recovery on the hourly chart. Price is currently trading around the moving average MA(30). The recent bearish crossover on the short term moving averages might push the pair down to 1.3460 If hourly candles close below this dynamic level. Expect more declines toward 1.3430.
If the pair breaks above 1.3550, this confirms the current uptrend and might push prices towards 1.3600 levels.
GBPUSD 1H Chart
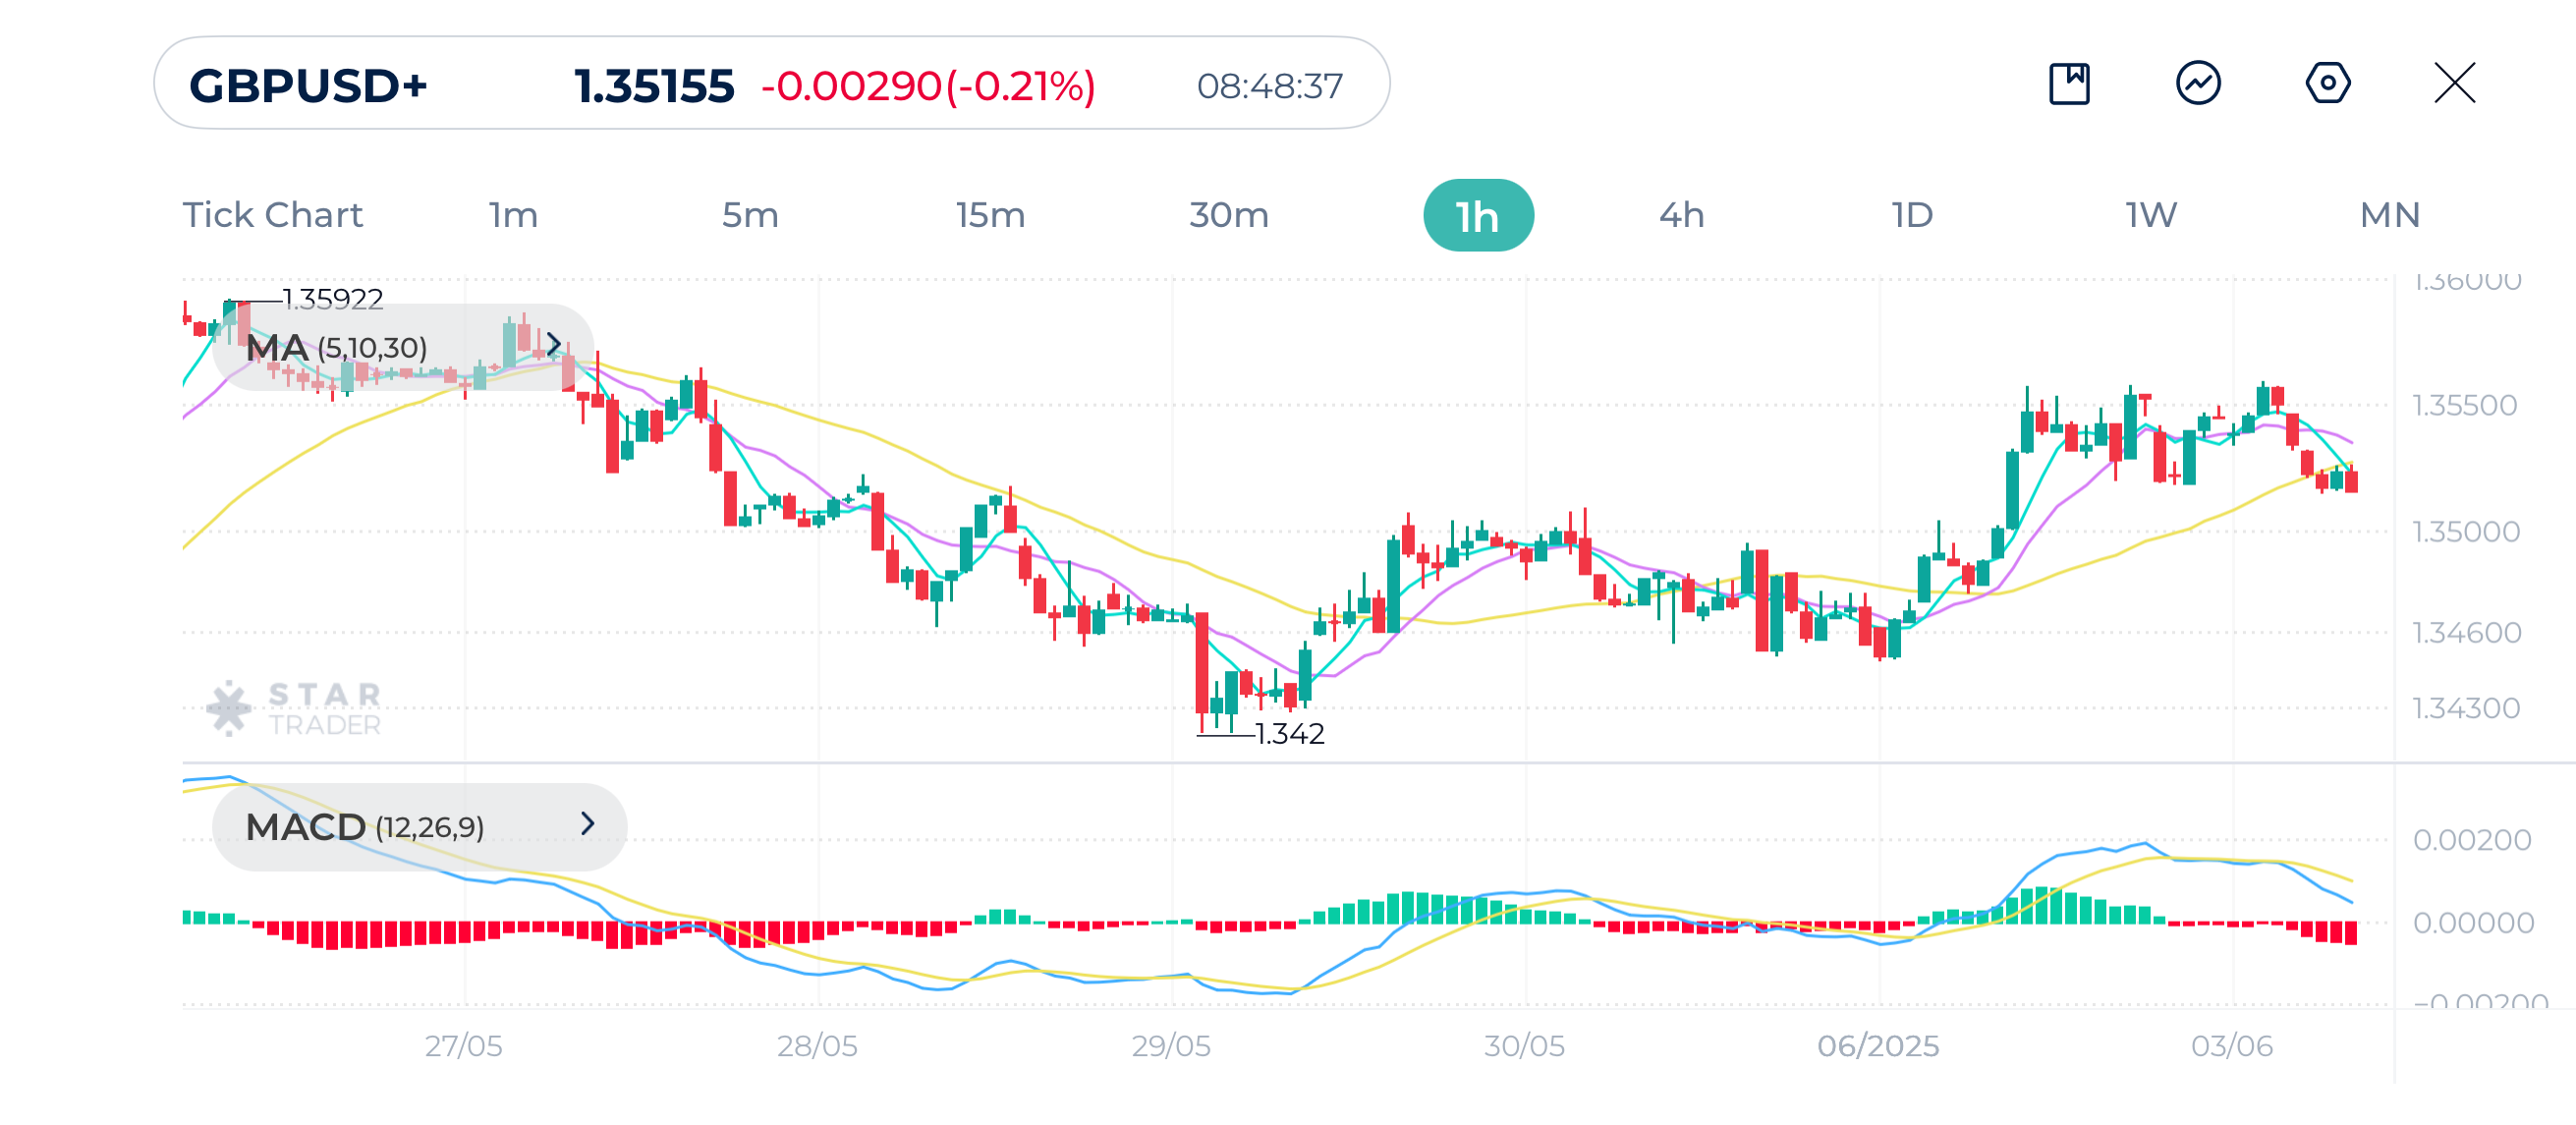
| Resistance | 1.3559 | 1.3573 | 1.3594 |
| Support | 1.3510 | 1.3472 | 1.3473 |
Gold has continued its upward trend since mid-may as it broke $3,390 in yesterday’s trading. The uptrend still looks healthy. Moving Averages MA (5, 10, 30) are all trending upward indicating slowing bullish momentum.
MACD shows a bearish crossover signaling downward correction in the short term, but the overall bullish trend remains in play.
It’s important to keep an eye on the psychological and historical support level of $3,350 which also coincides with the dynamic support MA (30). Failing to close on the hourly chart below this moving average confirms the continuation of the uptrend.
Gold (XAUUSD) 1H Chart
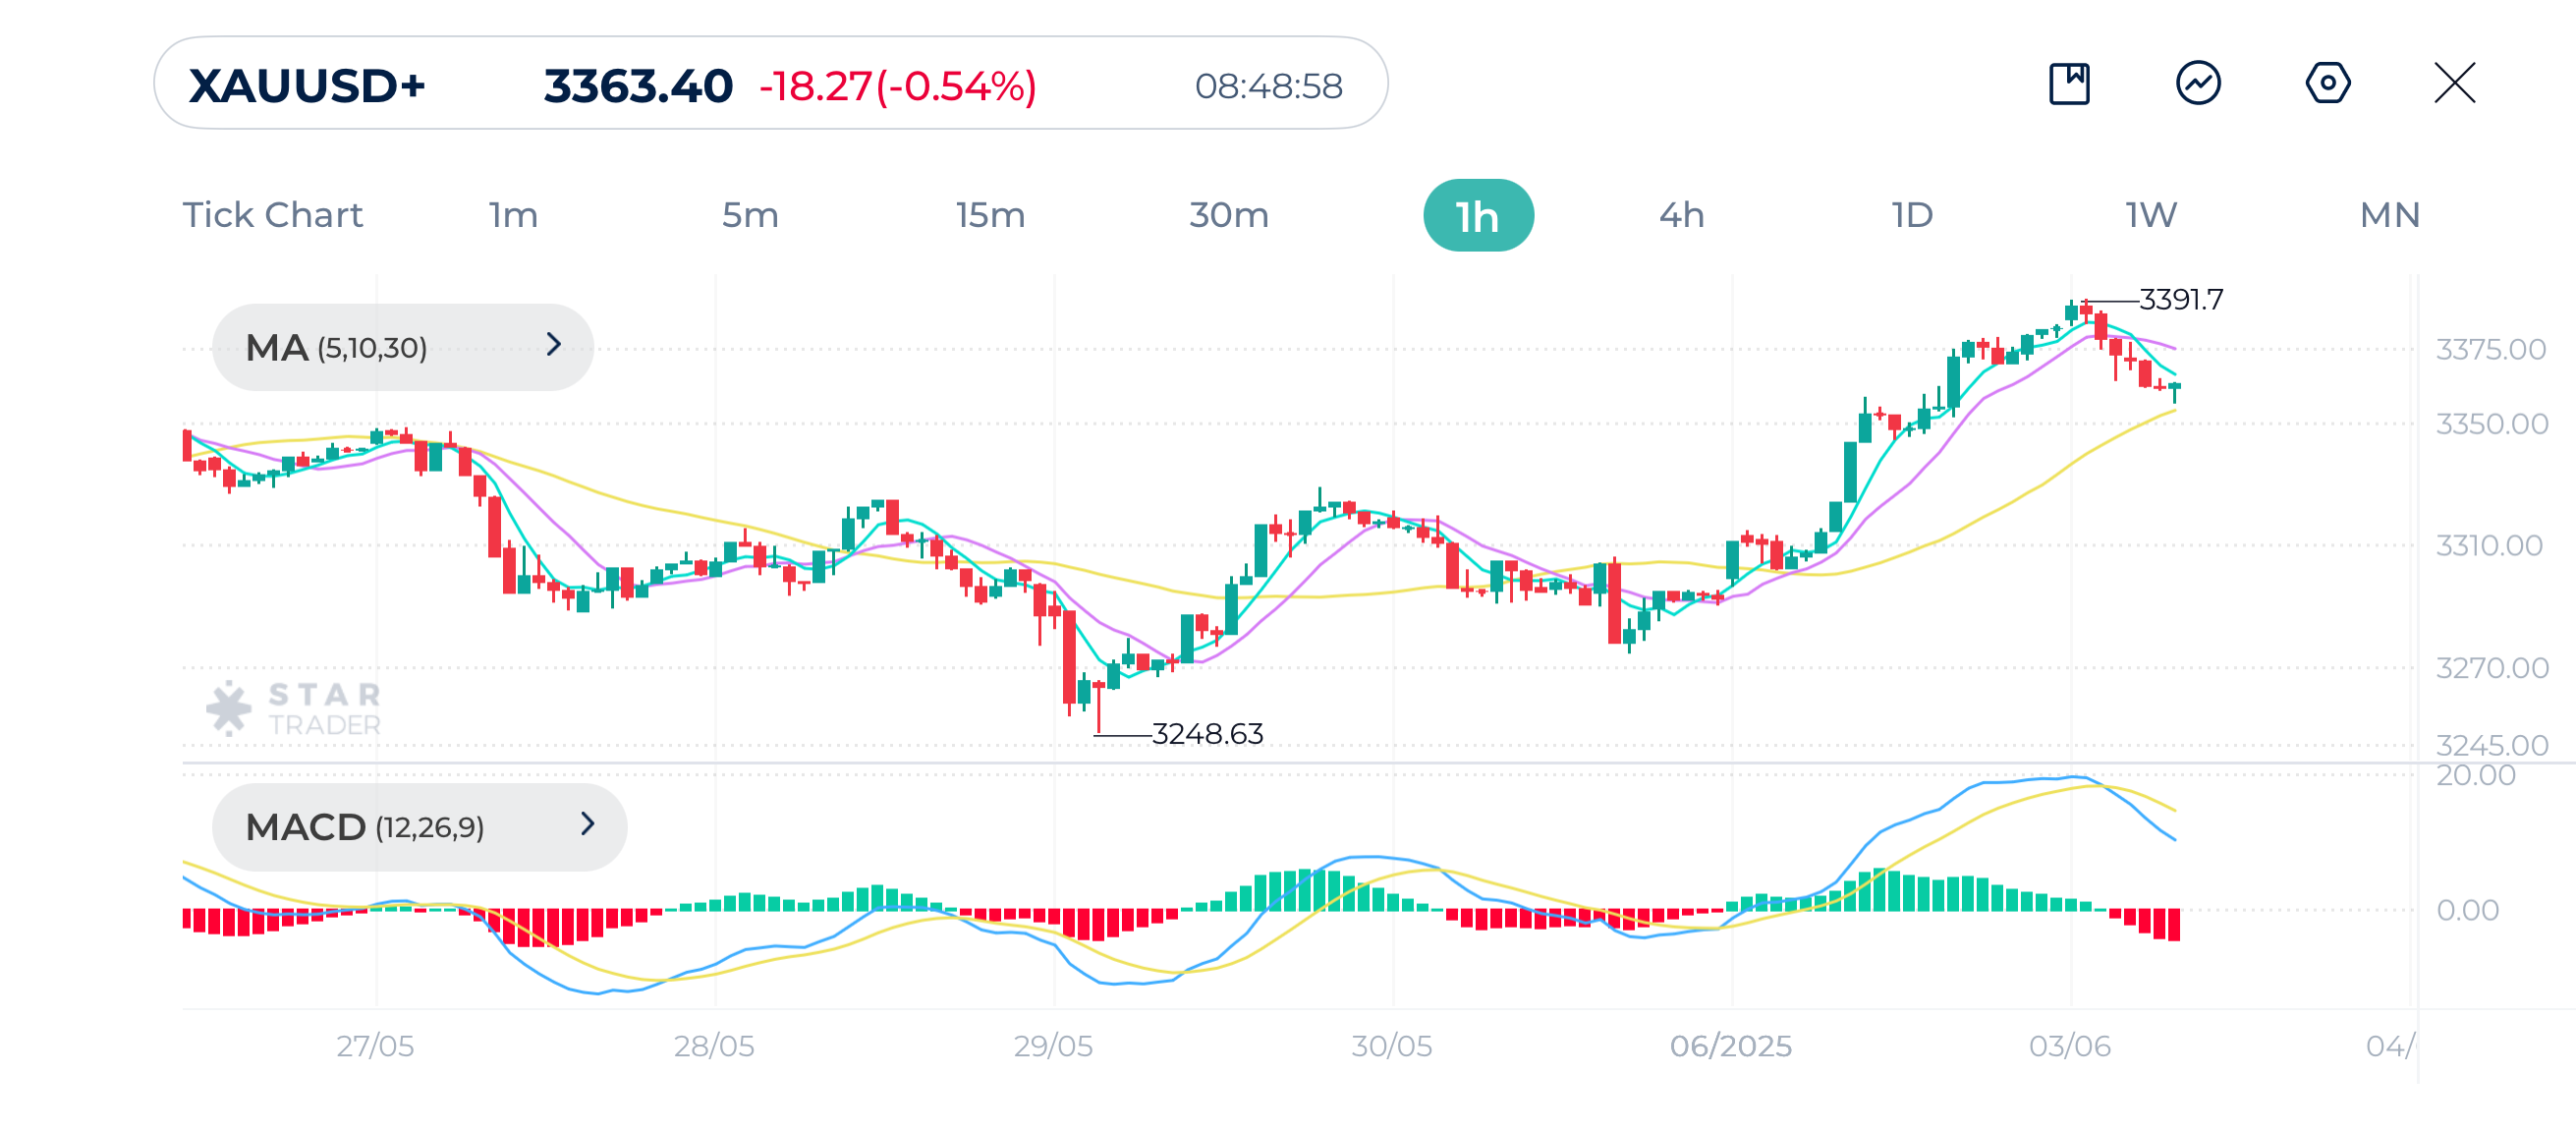
| Resistance | $3,378 | $3,392 | $3,400 |
| Support | $3,350 | $3,344 | $3,330 |
Tags
Open Live Account
Please enter a valid country
No results found
No results found
Please enter a valid email
Please enter a valid verification code
1. 8-16 characters + numbers (0-9) 2. blend of letters (A-Z, a-z) 3. special characters (e.g, !a#S%^&)
Please enter the correct format
Please tick the checkbox to proceed
Please tick the checkbox to proceed
Important Notice
STARTRADER does not accept any applications from Australian residents.
To comply with regulatory requirements, clicking the button will redirect you to the STARTRADER website operated by STARTRADER PRIME GLOBAL PTY LTD (ABN 65 156 005 668), an authorized Australian Financial Services Licence holder (AFSL no. 421210) regulated by the Australian Securities and Investments Commission.
CONTINUEImportant Notice for Residents of the United Arab Emirates
In alignment with local regulatory requirements, individuals residing in the United Arab Emirates are requested to proceed via our dedicated regional platform at startrader.ae, which is operated by STARTRADER Global Financial Consultation & Financial Analysis L.L.C.. This entity is licensed by the UAE Securities and Commodities Authority (SCA) under License No. 20200000241, and is authorised to introduce financial services and promote financial products in the UAE.
Please click the "Continue" button below to be redirected.
CONTINUEError! Please try again.