
Bitcoin still shows a strong bullish trend on the daily chart. Price is moving above moving averages (5, 10, 30) with clear bullish crossover
RSI is in the overbought levels near 70, indicating strong bullish momentum but a potential for a pullback.
Key Levels to watch in the short term are:
Support: Around 92,000–95,000 ( which represents previous consolidation and the moving average MA30).
Resistance: 105,063 ( which represents the latest high).
The uptrend remains intact with higher highs and higher lows shown on the chart. Caution is needed if RSI crosses 70 as it may trigger profit-taking and sudden decline in prices. A short-term retracement to moving average (MA10) or (MA30) could offer a new buying opportunity.
Bitcoin (BTCUSD) Daily Chart
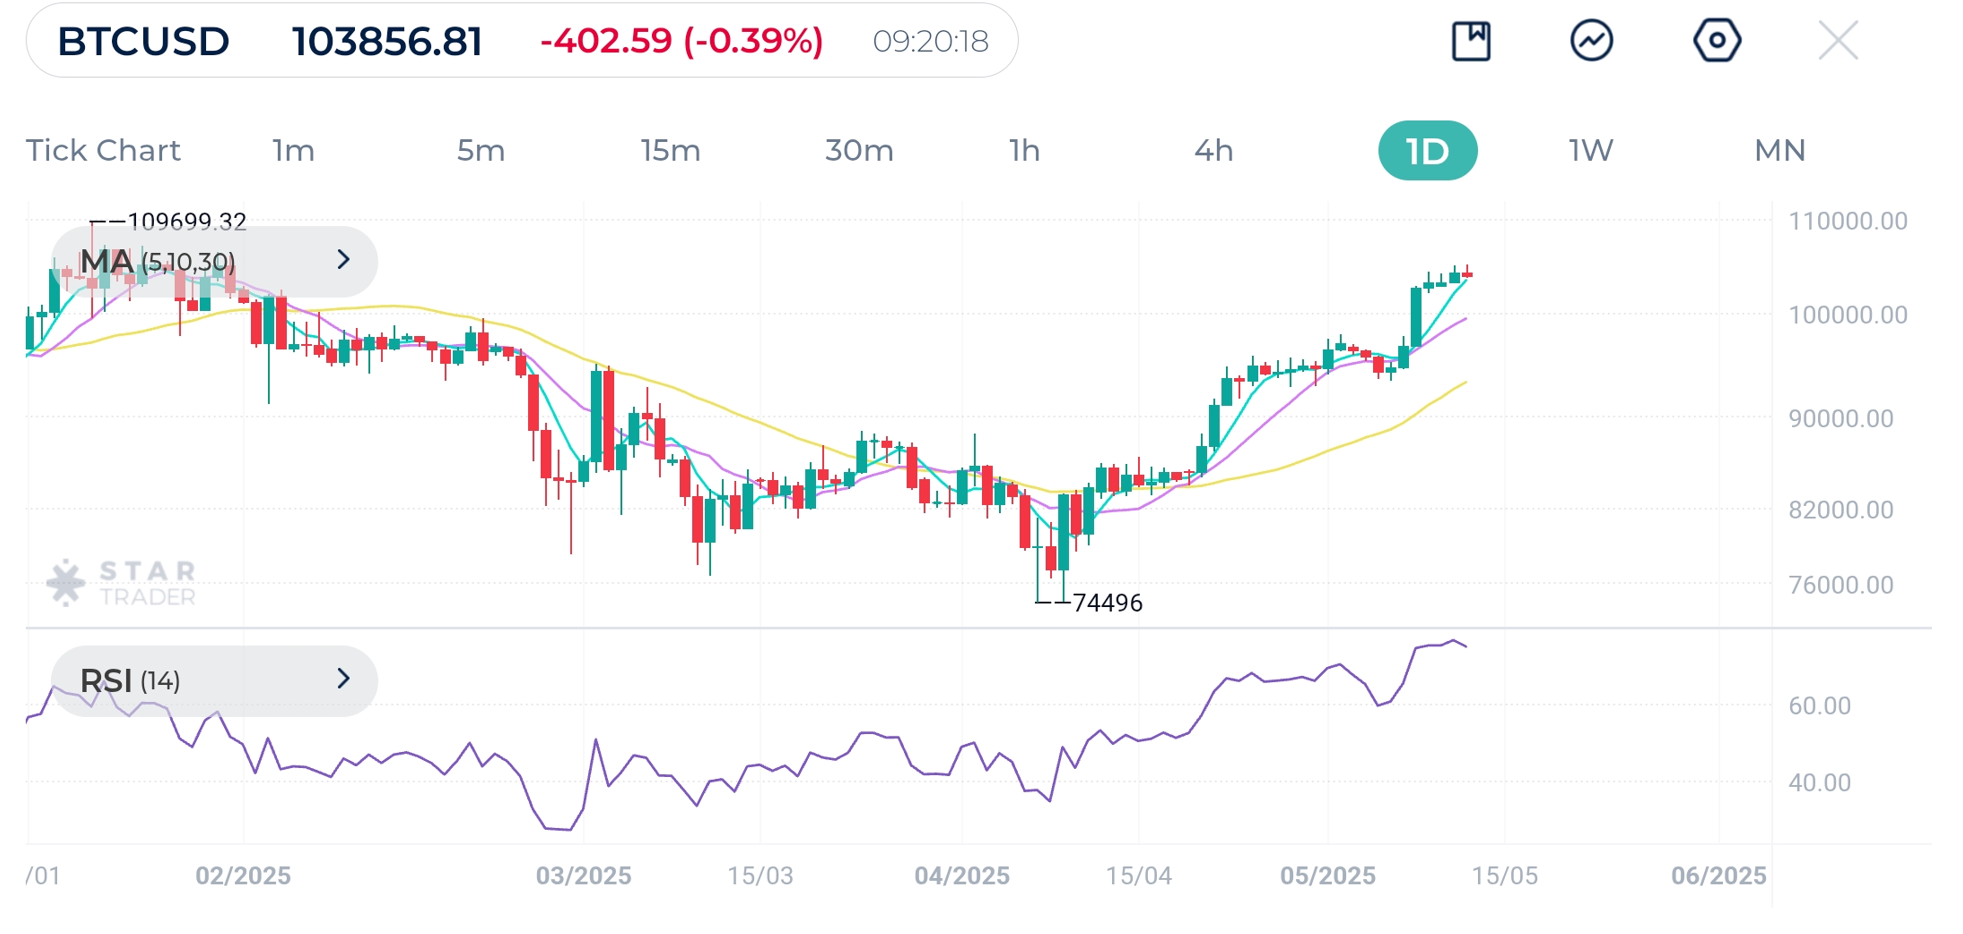
| Resistance | $105,226 | $106,453 | $107,271 |
| Support | $102,158 | $99,447 | $98.067 |
USDJPY shows continue its bullish trend, with price holding above moving averages (5, 10, 30): after the downward pullback. RSI is rebounding but not yet in overbought territory, and currently showing moderate bullish momentum.
Key levels to watch in today’s trading are:
Support: 145.60
Resistance: 146.28
The recent recovery on the pair looks healthy with a potential continuation above 146.28. As long as the price remains above the moving averages, the bullish bias is still valid. A break above 146.28 with 1H candle closure could trigger further upside movement toward 147.00.
USDJPY 1H Chart
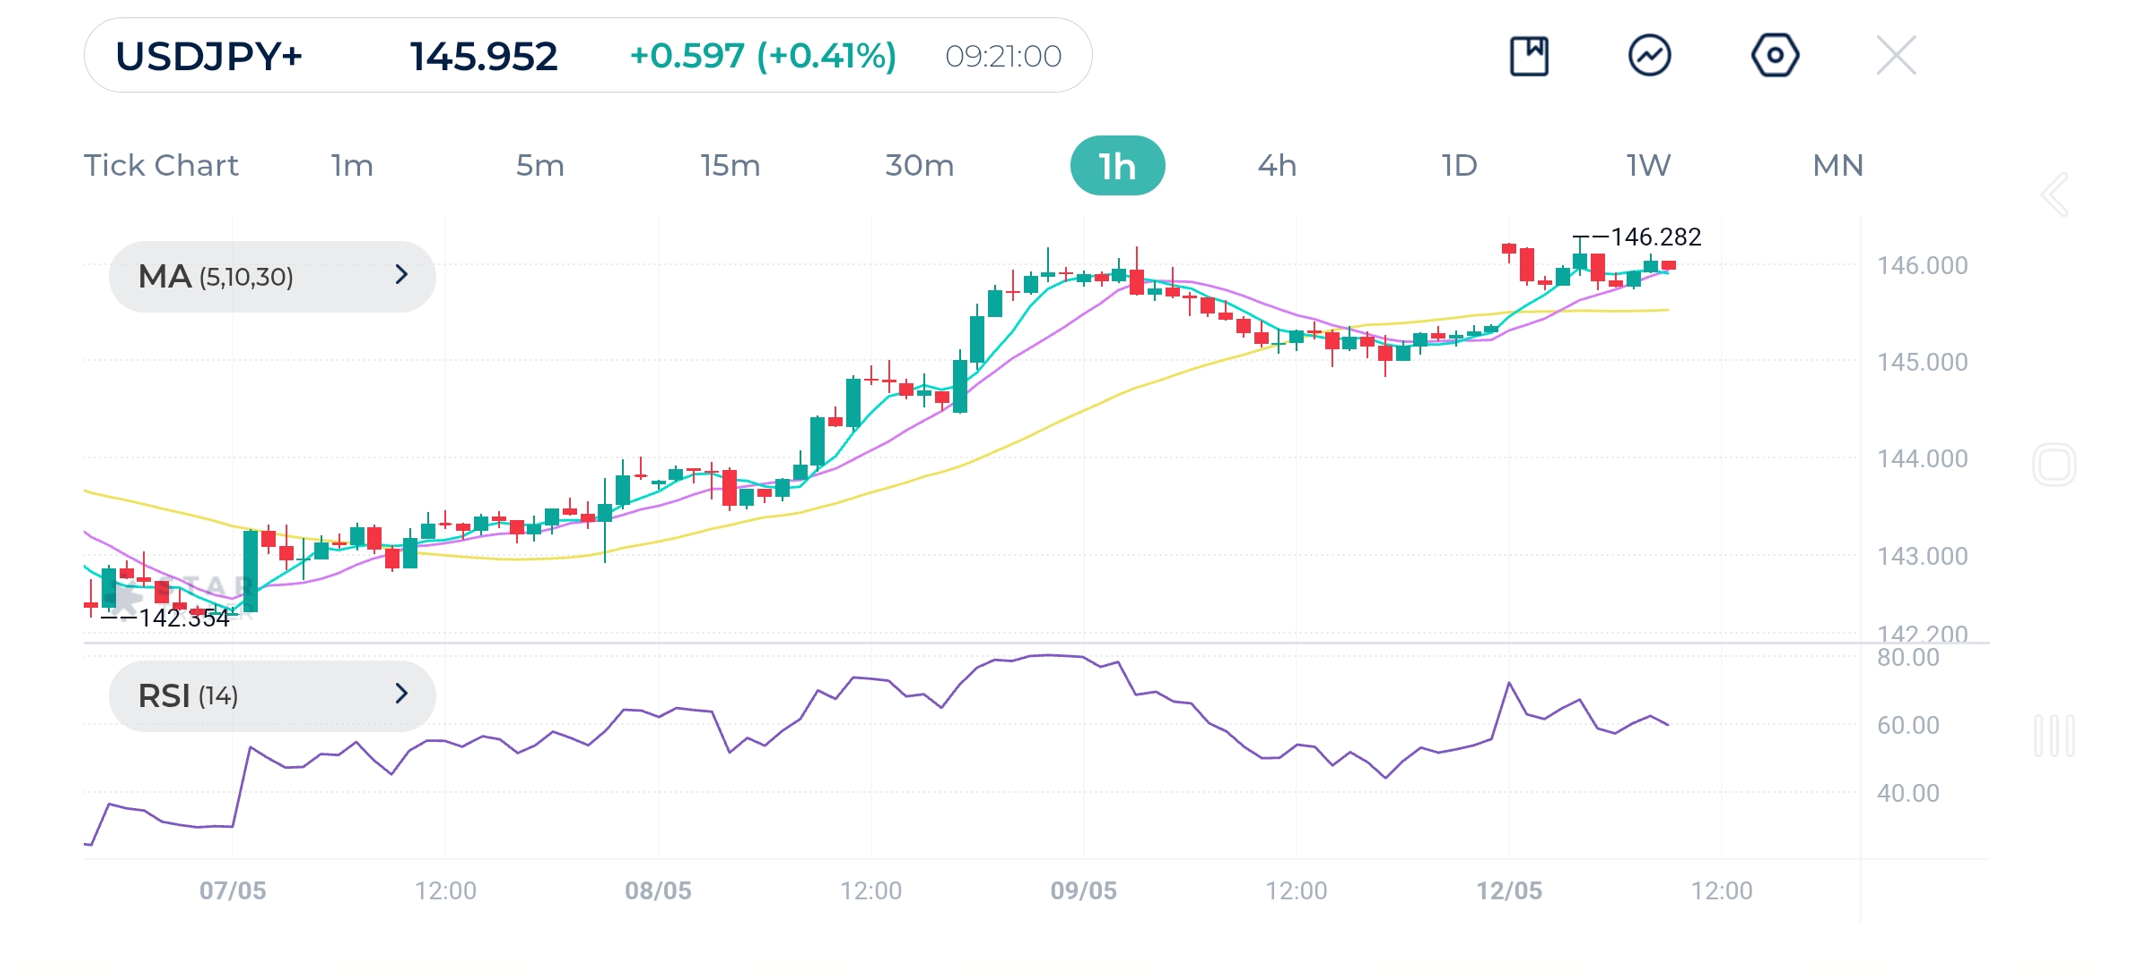
| Resistance | 146.29 | 147.15 | 147.67 |
| Support | 145.72 | 145.37 | 145.16 |
Following major fluctuations last week , gold is showing a clear bearish trend.
Moving averages (5, 10, 30) indicate bearish trend with crossover. RSI is below 40, reflecting bearish momentum but not yet oversold.
Key levels to watch in today’s trading are:
Support: 3270
Resistance: 3310–3325
Gold remains in a short-term downtrend with momentum favoring more downsides. If price breaks 3270, the next support could be around 3230. Buyers need to reclaim 3310–3325 to shift momentum.
Gold (XAUUSD) 1H Chart
| Resistance | $3,292 | $3,313 | $3,348 |
| Support | $3,258 | $3,253 | $3,222 |
Tags
Open Live Account
Please enter a valid country
No results found
No results found
Please enter a valid email
Please enter a valid verification code
1. 8-16 characters + numbers (0-9) 2. blend of letters (A-Z, a-z) 3. special characters (e.g, !a#S%^&)
Please enter the correct format
Please tick the checkbox to proceed
Please tick the checkbox to proceed
Important Notice
STARTRADER does not accept any applications from Australian residents.
To comply with regulatory requirements, clicking the button will redirect you to the STARTRADER website operated by STARTRADER PRIME GLOBAL PTY LTD (ABN 65 156 005 668), an authorized Australian Financial Services Licence holder (AFSL no. 421210) regulated by the Australian Securities and Investments Commission.
CONTINUEImportant Notice for Residents of the United Arab Emirates
In alignment with local regulatory requirements, individuals residing in the United Arab Emirates are requested to proceed via our dedicated regional platform at startrader.ae, which is operated by STARTRADER Global Financial Consultation & Financial Analysis L.L.C.. This entity is licensed by the UAE Securities and Commodities Authority (SCA) under License No. 20200000241, and is authorised to introduce financial services and promote financial products in the UAE.
Please click the "Continue" button below to be redirected.
CONTINUEError! Please try again.